
Data Analytics 360 with generative AI
The AI-Ready Data
Analyst
Learn Excel, statistics, MySQL, Python and Power BI the way
analysts use them at work, with AI tools built into every
module. Start from zero, finish with a portfolio of eight real
projects.
14 Weeks
Course duration
142 Hours
Guided learning
8 Projects
Plus a capstone
Beginner
No coding needed
Weekday and weekend batches. Live online and classroom.
Next batch: [Start date] Weekend batch: [Start date] Seats per batch: [Number]
Reserve a seat
Why analytics with
AI, and why now
SQL, Power BI and statistics still appear in almost every
analyst job description. What has changed is that employers
now also expect you to use AI tools well. Switch between
the two to see the difference.
What you learn
Excel, SQL, Power BI and Python, each taught on its own.
How you work
Clean data, build reports and refresh them by hand.
Projects
Separate exercises on unrelated datasets.
Quality of your numbers
AI use is left to you, with no guidance on checking it.
Interview readiness
Tool knowledge, but little practice explaining results.
How every module is taught
AI is not a separate add-on at the end. It sits inside each tool,
used the way working analysts use it.
Skill first
You write the formula, the query and the code yourself before any AI shortcut. You can’t check AI output in a skill you don’t have.
Then speed it up
You use ChatGPT, Claude and Microsoft Copilot to draft formulas, SQL, Python and DAX, explain unfamiliar work and summarise results.
Always verify
Every AI step is followed by a check: test rows, row counts, a hand calculation. Employers want analysts whose numbers can be trusted.
Curriculum
Seven modules and a capstone, in the order analysts use the tools. Open
any module to see topics, where AI comes in, and the project you build.
Generative AI for analysts
A short opening module so you use AI tools well from week one, and know their
limits before you rely on them.
What you'll learn
- How large language models produce answers, and why they sometimes make things up
- Prompting for analysis: giving context, a role, the output format and an example
- ChatGPT, Claude and Microsoft Copilot compared on the same task
- Data privacy: what should never be pasted into a public AI tool
- A simple checking routine for any number an AI gives you
- Using AI to get your bearings in a dataset you've never seen
Where GenAI comes in
- This whole module: the working habits every later module builds on
- Writing reusable prompt templates you'll keep for the rest of the course
- Spotting a confident but wrong answer
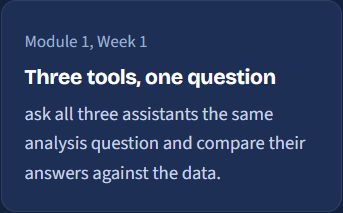
Hands-on Ask three AI tools the same question about a sample sales file, then compare where each was right, wrong or vague.
Excel with GenAI
Still the tool most business data passes through. You’ll go from basic formulas to
repeatable, automated reports.
What you'll learn
- Cleaning data: text functions, Flash Fill, removing duplicates, data validation
- Lookups and logic: XLOOKUP, INDEX-MATCH, IF, IFS, SUMIFS, COUNTIFS
- Dynamic arrays: FILTER, SORT, UNIQUE
- Pivot tables, pivot charts and slicers
- Power Query for cleaning you can refresh with one click
Where GenAI comes in
- Turning a plain-English rule into a working formula, then explaining it back
- Debugging a broken or nested formula
- Copilot in Excel to summarise a table and suggest pivots
- Drafting Power Query steps for messy imports
Hands-on Combine and reconcile a messy sales ledger from three Meridian branches, then build a monthly performance report with pivots and slicers.
Statistics for analysts with GenAI
A focused grounding: enough statistics to know when a pattern is real. Taught in
Excel so the ideas come first, not the maths.
What you'll learn
- Types of data; mean, median, mode, spread and percentiles
- Distributions, skew and outliers
- Samples, populations and confidence intervals
- Hypothesis testing in plain language: the t-test and p-values
- Correlation versus causation
Where GenAI comes in
- Choosing the right test with AI, then justifying the choice yourself
- Turning a statistical result into a two-line summary for a manager
- Catching statistical claims AI tools commonly get wrong
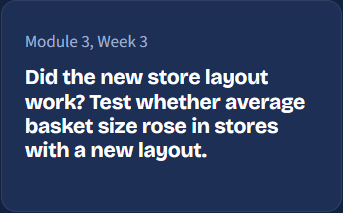
Hands-on Meridian changed the layout in ten stores. Test whether average basket size really went up, and write the finding for a non-technical reader.
MySQL with GenAI
Most company data lives in databases. SQL is the skill interviewers test most often
for analyst roles.
What you'll learn
- How relational databases work: tables, keys and relationships
- SELECT, WHERE, ORDER BY, LIMIT
- Aggregation with GROUP BY and HAVING
- Cleaning and transforming in SQL: CASE, string and date functions, NULL handling
- Joins: inner, left and self joins
- Subqueries and CTEs
- Window functions: RANK, running totals, LAG and LEAD
- Views and basic indexing
Where GenAI comes in
- Turning a business question into SQL, then reading it line by line
- Explaining a long query someone else wrote
- Suggesting why a query is slow or returns the wrong row count
- Generating realistic test data
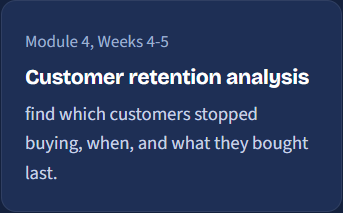
Hands-on Customer retention analysis on the Meridian database: repeat purchase rate and cohorts by first-order month.
Python foundations
Programming basics for people who have never coded, taught with data from day
one, through to functions and object-oriented programming.
What you'll learn
- Setting up Python and working in Jupyter notebooks
- Variables, data types and strings
- Lists, tuples, dictionaries and sets
- Conditions, loops and comprehensions
- Functions with def, and lambda with map, filter and reduce
- zip and enumerate for cleaner loops
- Object-oriented programming: classes, objects, methods and inheritance
- Reading and writing files; handling errors
Where GenAI comes in
- Using AI as a tutor that explains error messages
- Asking for hints rather than full answers while you're learning
- Getting feedback on functions and classes you've written
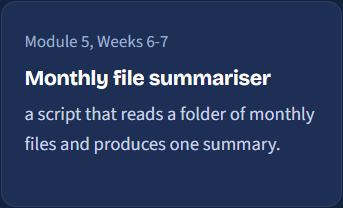
Hands-on Build a MonthlyReport class that reads twelve monthly CSV files, cleans them with map, filter and reduce, and produces a single summary of sales by store.
Advanced Python for analytics with GenAI
The data analyst’s main Python toolkit, calling an AI model from your own code,
and turning your analysis into a web app.
What you'll learn
- NumPy arrays, vectorised calculations and broadcasting
- pandas: selecting, filtering, groupby, merging and reshaping
- Cleaning at scale: missing values, data types, dates
- Charts with Matplotlib and Seaborn
- A repeatable exploratory data analysis workflow
- Connecting Python to MySQL
- An introduction to prediction with scikit-learn: regression, train and test data
- Building interactive data apps with Streamlit
- Sharing an app through a secure ngrok link
- Automating a weekly report
Where GenAI comes in
- AI coding assistants inside notebooks
- Calling an AI model from Python to sort and label customer comments
- Generating chart and Streamlit code, then fixing what's wrong with it
- Adding an ask-a-question AI feature to a Streamlit app
- Documenting your code
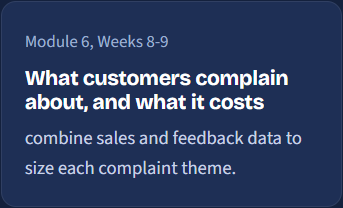
Hands-on Label 2,000 Meridian customer reviews by theme using an AI model, check a sample by hand, join the results to store sales, and build a Streamlit app managers can open through an ngrok link.
Power BI with GenAI
The longest module on the course. You’ll go from first report to a published,
secured dashboard people use to make decisions.
What you'll learn
- Power Query in Power BI
- Data modelling: star schema and relationships
- DAX: calculated columns versus measures, CALCULATE and filter context
- Time intelligence: year to date, same period last year, rolling averages
- Advanced DAX: variables, iterators such as SUMX, and ranking
- Designing visuals for decisions, not decoration
- Slicers, drill-through, tooltips and bookmarks
- Checking and improving report performance
- Power BI Service: workspaces, apps, scheduled refresh and sharing
- Row-level security so each manager sees only their region
Where GenAI comes in
- Writing and explaining DAX measures with AI
- Copilot in Power BI to draft report pages and summaries
- Natural-language Q&A visuals
- AI-drafted commentary for executives, checked against the numbers
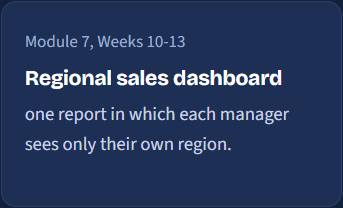
Hands-on Build and publish Meridian’s regional sales dashboard, with drill-through from region to store, scheduled refresh and row-level security so each regional manager sees only their stores.
Capstone project
Answer the opening question yourself, from raw files to a recommendation, using
every tool on the course.
What you'll learn
- Clean the raw Meridian exports in Excel and Power Query
- Load and query them in MySQL
- Analyse drivers and customer feedback in Python
- Test whether the margin drop is statistically real
- Present findings in a Power BI dashboard
- Give a 10-minute presentation to a review panel
Where GenAI comes in
- You decide where AI helps and record every place you used it
- The panel asks you to show how you checked each AI-assisted step
You leave with A finished portfolio project on GitHub, a live dashboard and a presentation you can walk an interviewer through.
One business, eight projects
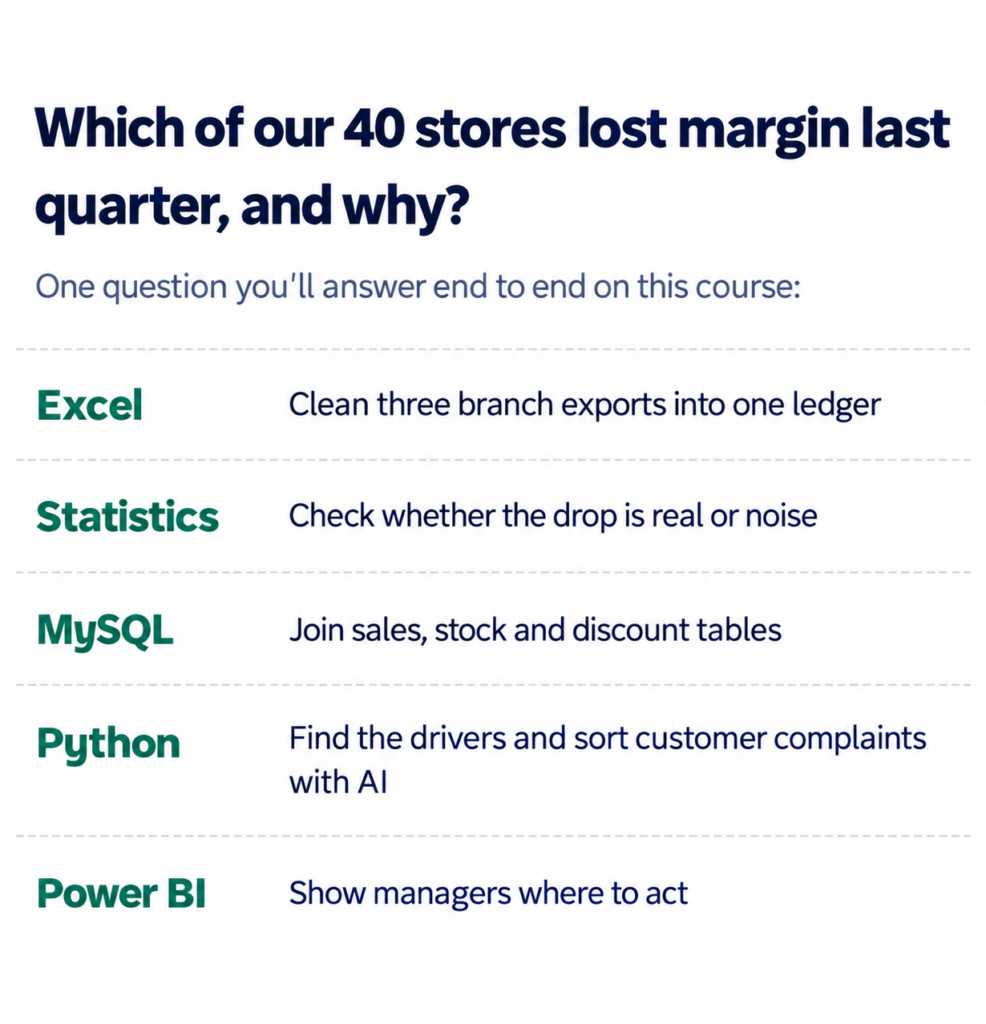
Every project uses Meridian Retail, a fictional chain of 40 stores across four
regions. Each module builds on the last, so by the end you can take one
real business question from raw files to a recommendation:
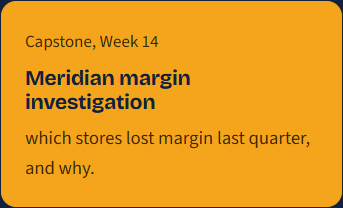
Which of our 40 stores lost margin last
quarter, and why?

Tools you will use
All industry standard. Highlighted tools are the AI assistants used across
the course.
Roles this course prepares you for
The skills map directly to the entry and early-career roles companies hire
for most often in analytics.
Data Analyst
Query, clean and analyse data, and turn it into
reports and recommendations.
Business Analyst
Work with teams to define business questions
and answer them with data.
BI or Power BI Developer
Build data models, DAX measures and
dashboards used across the business.
MIS Analyst
Own recurring reports in Excel and SQL, and
automate the manual parts.
Reporting Analyst
Maintain KPIs, check data quality and explain
movements to managers.
Operations or Sales Analyst
Apply analytics inside a function to track
performance and find savings.
Frequently Asked Questions
Yes. Python starts from the very beginning in module 5, and by then you’ll already have spent several weeks thinking in rows, columns and queries through Excel and SQL, which makes the move to code much easier.
No. The free versions of ChatGPT and Claude cover almost everything on the course. Copilot features in Excel and Power BI need a Microsoft licence; we demonstrate them in class, and every exercise has a route that works without one.
Because AI output is often nearly right, and nearly right is the dangerous kind of wrong. Employers hire analysts who can read, test and fix what an AI produces. That needs the underlying skill.
Knowing whether a pattern is real shapes every analysis that follows. Learning it early in Excel, where you can see every calculation, means you apply it naturally when you move to code.
A capstone project on GitHub covering all five tools, a live Power BI dashboard, and smaller projects from each module. [Add any placement or career support you offer here.]
[Recordings are shared after every session, and you can bring questions to the next doubt-clearing slot.]
Talk to us about the next batch
Tell us where you’re starting from. We’ll call you back, walk you through the course and tell you honestly whether it suits your goals.